VSCode Remote Debugging
Supported Languages#
| Language | Required Plugin | Dev Image Required |
|---|---|---|
| Java | Debugger for Java | N/A |
| Go | Go | dlv |
| Python | Python | debugpy |
| PHP | PHP Debug | xdebug |
| Node.js | N/A | N/A |
| Ruby | Ruby | ruby-debug-ide |
Plugin Configuration#
- Java
- Go
The path to the Java Development Kit can be specified by the java.home setting in VS Code settings (workspace/user settings). If not specified, it is searched in the following order until a JDK meets current minimum requirement,for extension jdk configuration, see Setting the JDK.
- the
JDK_HOMEenvironment variable - the
JAVA_HOMEenvironment variable - on the current system path
The extension uses a few command-line tools developed by the Go community。in particular, go, gopls, and dlv must be installed for this extension to work correctly. See the tools documentation for a complete list of tools the extension depends on.
In order to locate these command-line tools, the extension searches GOPATH/bin and directories specified in the PATH environment variable (or Path on Windows) with which the VS Code process has started. If the tools are not found, the extension will prompt you to install the missing tools and show the "⚠️ Analysis Tools Missing" warning in the bottom right corner. Please install them by responding to the warning notification, or by manually running the Go: Install/Update Tools command.
Debugging Process#
- Select the workload that you want to debug
- Right-click the workload and select
Dev Config, configure your debugging configuration - Then right-click this workload again and select
Remote Debug - Nocalhost will automatically install the dependencies on the first debug
- Nocalhost will automatically enter the
DevModeand start remote debugging
Configuration#
The development environment is different between developers. You should configure remote debug configurations according to the actual situation.
Sample Configuration#
- Java
- Python
- Go
- PHP
- Node.js
- Ruby
Maven Example#
The shell command for Maven example:
For jdk <=1.7 you should replace -agentlib:jdwp=transport=dt_socket,server=y,suspend=n,address=*:5005 with -Xdebug -Xrunjdwp:transport=dt_socket,server=y,suspend=y,address=5005
For lower version of the springBoot you should replace -Drun.jvmArguments with -Dspring-boot.run.jvmArguments
Gradle Example#
The startup command for Gradle example:
- VSCode
- Jetbrains
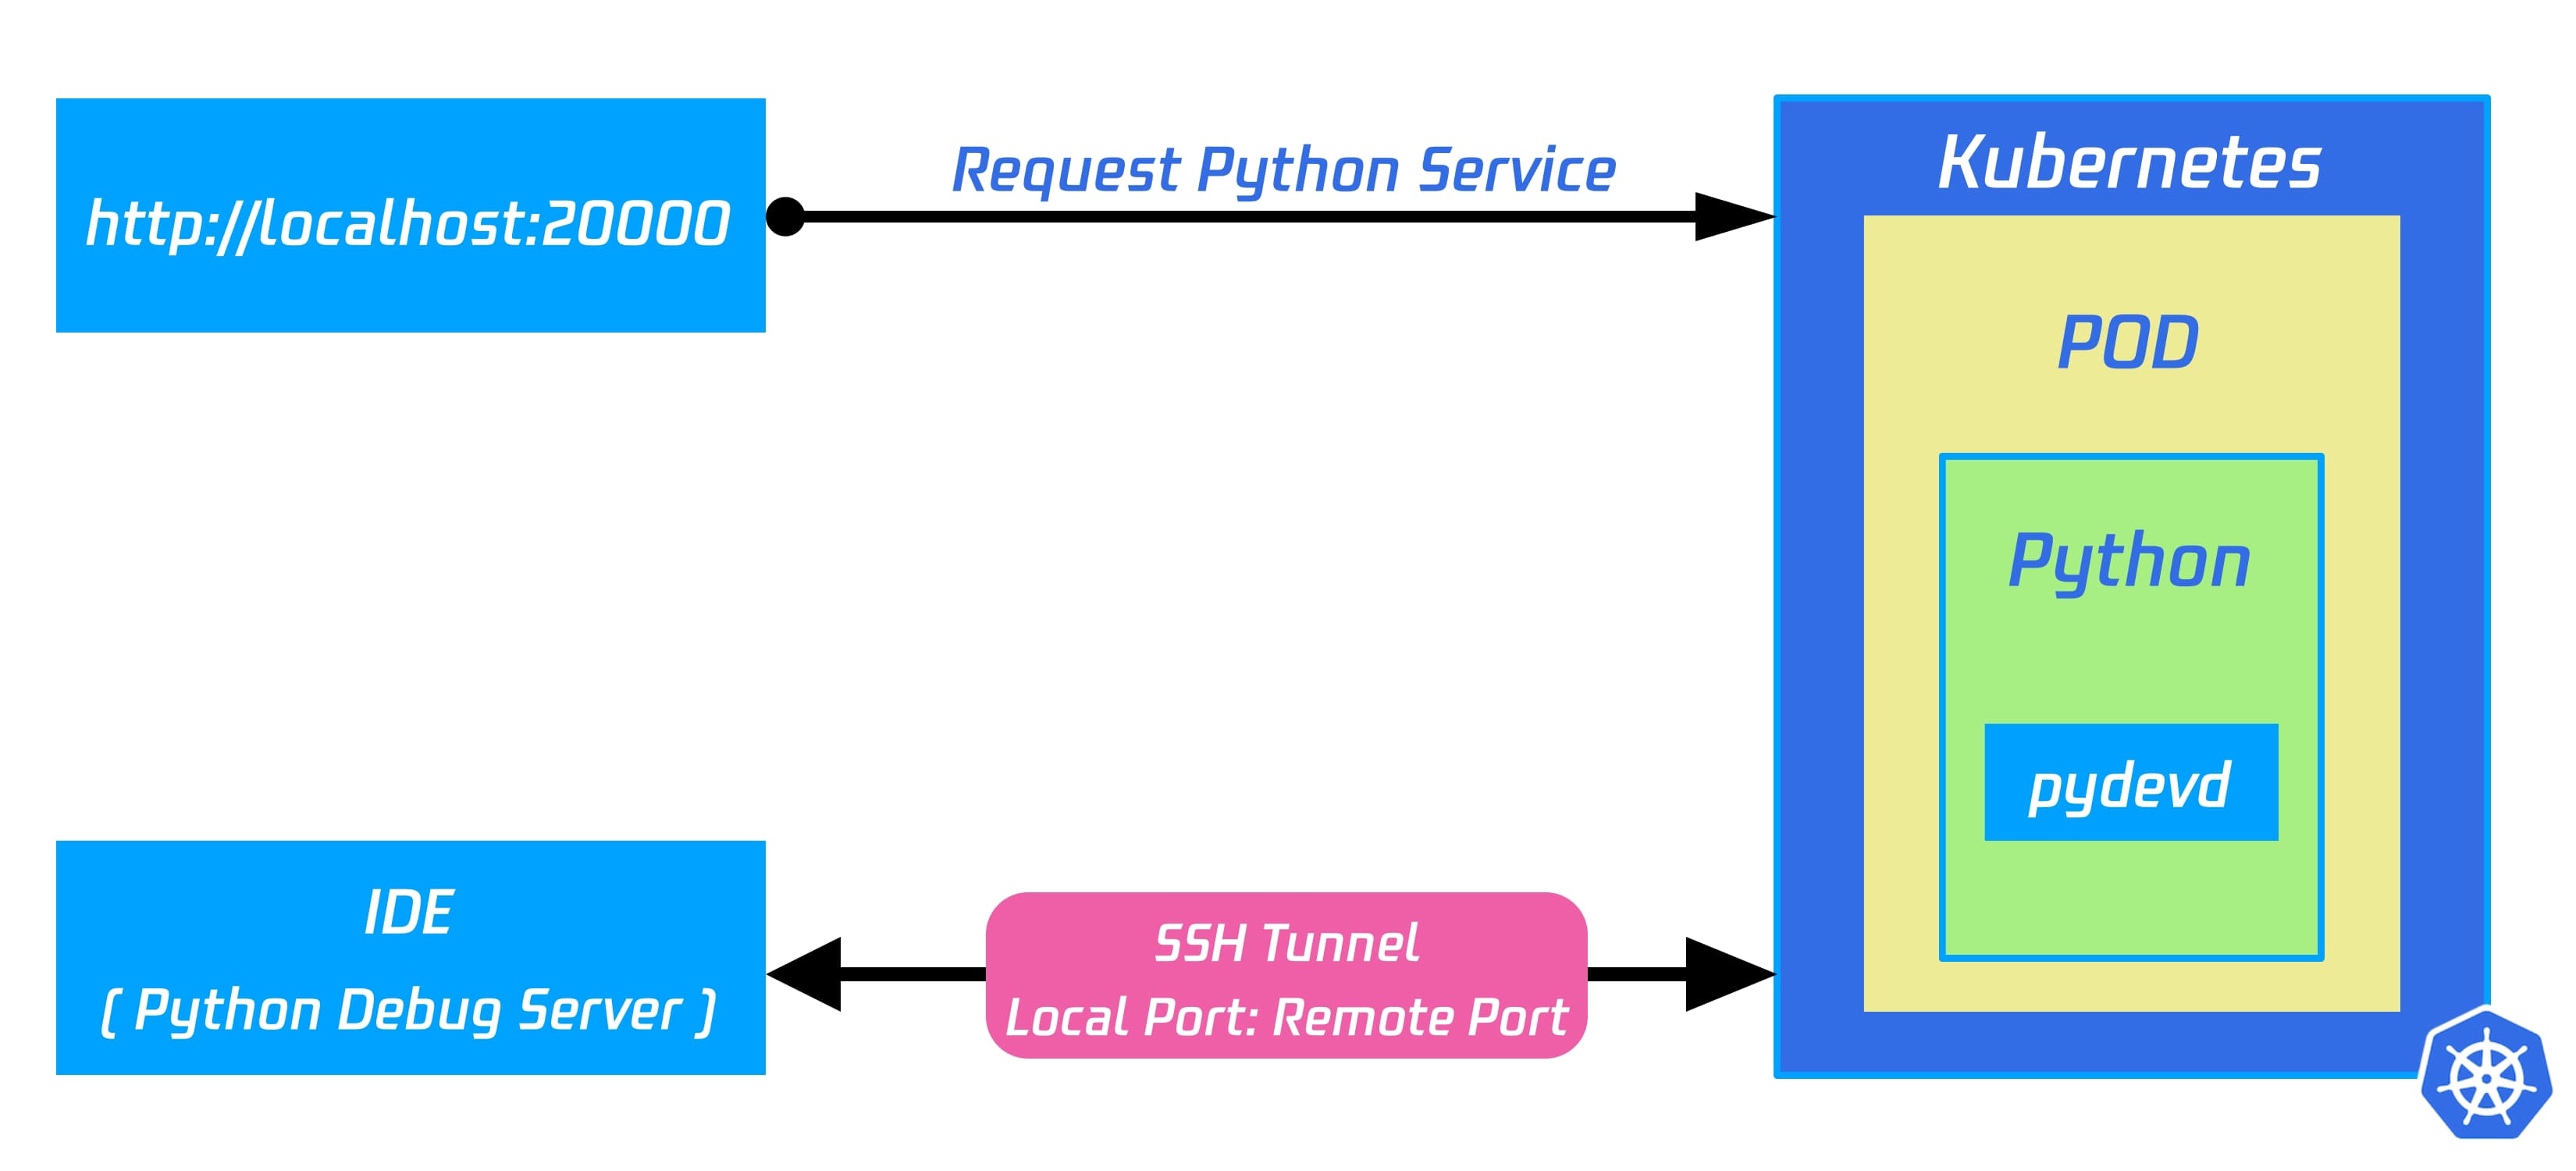
How does it Works?
Nocalhost using pydevd to debug Python application.
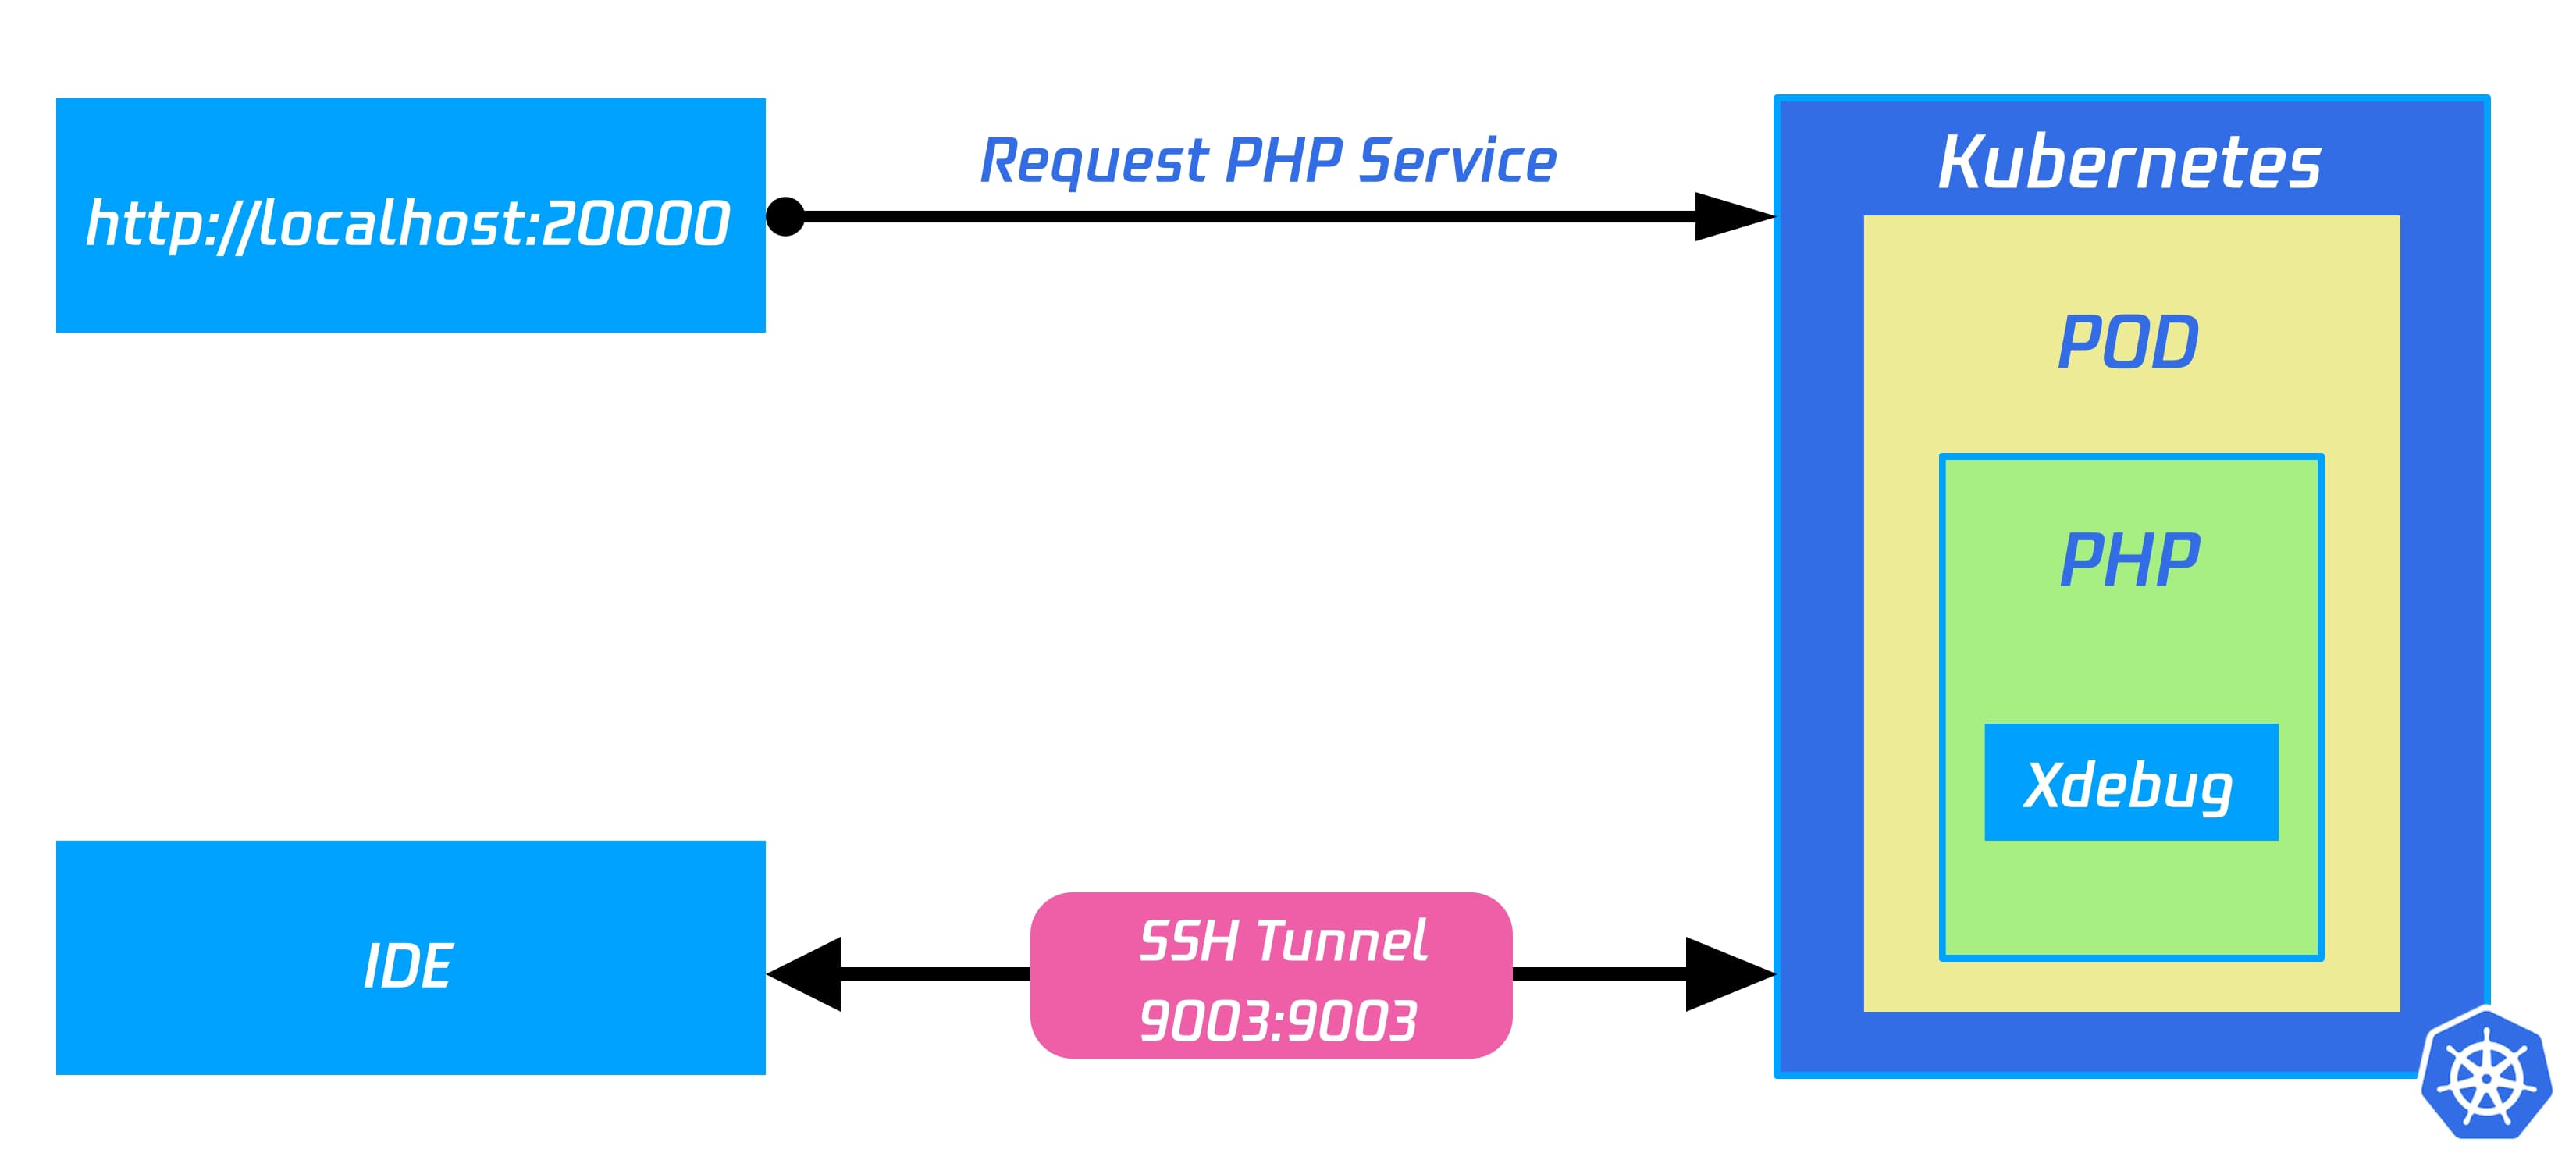
How does it works?
Nocalhost using Xdebug to debug PHP applications.
Debugging Configurations in IDE#
VSCode debug configuration#
nocalhost will automatically configure launch.json of vscode when debug is finished, next time you can launch debug directly with shortcut key F5
Debugging parameters#
debug supports custom parameters to start, you just need to add parameters under configurations in launch.json, and the plugin will pass the parameters to the debugger when debug is launched.
If you need to enable diagnostic output when debugging a Node.js application, you just need to change the following configuration.
Supported debugging parameters#
FAQ#
The java debugger stops at return ma.invoke(obj, args);in the java.lang.reflect.Method.class file.#
Execute the Java: Clean the Java language server workspace command